Arduino Projects..
Arduino Projects with detailed step by step guide
1, Arduino Radar (Sonar)
This is one of my most popular project and it’s really fun to build. The radar can detect objects in front of it and map them on PC screen using the Processing IDE. processing code
circuit diagram
Download Arduino Ide
Download Processing org
2, How to Flash the Firmware on Clone HM-10 BLE Module using Arduino Uno
How to Flash the Firmware on Clone HM-10 BLE Module using Arduino Uno
While using the BLE HM-10 module,
you must encounter some really frustrating problems like you cannot
send or receive AT commands, or you cannot pair HM-10 with Smart Phone.
If you encounter these problems, then your BLE HM-10 module is surely a
Cloned HM-10 Module. Yes, you heard it right, the Cloned HM-10 module.
However after flashing it with genuine firmware it acts like a genuine
BLE HM10 module and can be used as original Bluetooth module. Here we
have interfaced HM10 BLE module with Arduino Uno to control an LED.

What is a Cloned HM-10 Module?
Cloned HM-10 modules are similar to the Genuine
HM-10 module. But to save the extra cost while manufacturing, the
manufacturers removed the external oscillator and leaves the space for
the External Oscillator. The manufacture used the internal oscialltor of
HM-10 module for saving the cost. Also, the firmware is different than
the genuine HM-10 module.
BLE HM-10 module is a Bluetooth Low Energy (BLE) module built on Texas Instrument’s CC2540 or CC2541.
Chinese manufacturer Jinan Huamao Technology is developer of the board
and the firmware. The Manufacturer has stated on the official
documentation that there are several clones available in the market.
How to distinguish between Genuine and Clone HM10 BLE Modules
There are two types of BLE HM-10 modules available, the genuine and Chinese cloned. To identify the difference the between the genuine and Chinese Cloned HM-10 module, there are some points to do that.
1. The first point is by looking at the HM-10 module. If the Crystal Oscillator of 32KHz is available on the HM-10 board then it is Genuine one else it is the Chinese Cloned HM10.
2. The second way to find is by connecting the
HM10 with any Serial Module and sending AT commands. If the HM-10
doesn’t reply to AT commands, then it is a Cloned HM-10 module.
How to change or Flash the firmware of Clone HM-10 BLE Module
In order to change the firmware, we really need a
good hand on soldering. Once you change the firmware of the HM10 module.
You will be able to access all its functions. There are two methods to
flash the cloned HM10 module:

1. The first method includes the SmartRF Flash Programmer from Texas Instruments.
2. And the second method includes the Arduino as programmer for HM-10.
In this tutorial, we will use the second method of flashing the HM-10 module i.e. Arduino as Programmer for HM-10.
So lets start the steps in Flashing the HM-10 module using Arduino UNO
as Programmer. As said earlier, the soldering will be required to
connect HM-10 with Arduino. We need to solder the wires to the
DEBUG_CLOCK, DEBUG_DATA, RESET_N pins of HM-10. Then complete procedure
is explained in next sections.
Components Required
Hardware
- Arduino (UNO, Pro Mini)
- USB to TTL converter for connect Arduino to the PC (in case of arduino pro mini or similar)
- CC2541 board: HM-10, CC41
- Some Jumper Wires
- Soldering Iron (To solder the wire to HM-10 Board)
Software:
- Arduino IDE
- CCLoader Arduino Sketch
- CCloader Windows Program
- HM-10 Firmware (Extract the Zip file)
HM-10 Pin Out
Circuit Diagram
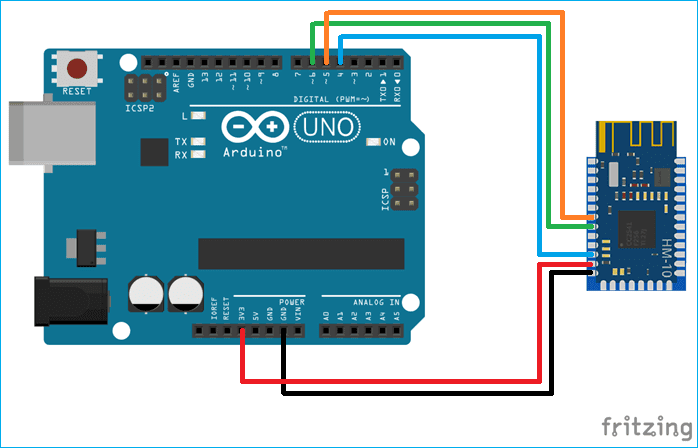
Firstly, solder the small jumper wires with HM-10 Board pins then proceed with the circuit connections with Arduino to flash the firmware inside HM10 BLE Module.
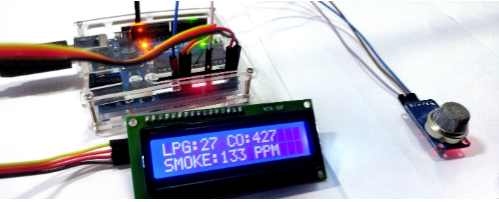
3, Build your own gas and smoke detector that can read and display smoke levels using the MQ-2 and an Arduino.
| Hardware | |||
|---|---|---|---|
| 1 | Arduino Uno | ||
| 2 | MQ2 Sensor | ||
| 3 | I2C Character LCD | ||
This
tutorial walks you through building a smoke detector that not only
senses smoke and other harmful gases in the air but also reads and
displays smoke levels in PPM (parts per million).
When the smoke concentration is above 1000 ppm, the circuit triggers a buzzer that can be changed in the code as required. This project uses the MQ-2 sensor and an Arduino to determine and detect different smoke intensities.
This smoke detector can be easily built onto a breadboard or a polka dot plate. The MQ-2 sensor is used to detect the levels of gas around the area, so you can utilize this sensor as a gas leak monitoring system for homes, businesses, or factories, and is suitable for monitoring devices such as gas, butane, propane, methane, alcohol, hydrogen, and smoke.
What is the MQ-2 Smoke Sensor?
The MQ-2 smoke sensor is sensitive to smoke and also responsive to the following flammable gases:- LPG
- Butane
- Propane
- Methane
- Alcohol
- Hydrogen

The
resistance of MQ2 varies depending on the type of gas. The smoke sensor
has a built-in potentiometer that adjusts the sensitivity of the sensor
based on the accuracy of the gas you are testing.
How Does the MQ-2 Work?
The sensor’s voltage output varies proportionately with the measured smoke/gas in the atmosphere. In other words, the relationship between voltage and gas concentration is as follows:- The higher the gas concentration, the higher the output voltage.
- The lower the gas concentration, the lower the output voltage.
MQ-2 Specifications
- Dimensions: 35 mm x 22 mm x 23 mm (length x width x height)
- Main chip: LM393, ZYMQ-2 gas sensor
- Working voltage: DC 5V
MQ-2 Features
- With signal output command.
- Dual signal output (analog output and high/low digital output).
- 0~4.2V analog output voltage, the higher the concentration, the higher the voltage.
- It has higher sensitivity to natural gas, natural gas and city gas.
- Long service life, stable and reliable.
- Fast response and recovery features.


Wiring Up the Project
Wire up everything as described below:
Arduino
|
MQ2
|
|---|---|
A0
|
A0
|
5V
|
VCC
|
GND
|
GND
|
Arduino
|
I2C LCD
|
|---|---|
VCC
|
5V
|
GND
|
GND
|
SDA
|
A4
|
SCL
|
A5
|


Project Source Code
After you are done with the connections, connect the Arduino to your computer and upload the source code below:arduino
#include <MQ2.h>
#include <Wire.h>
#include <LiquidCrystal_I2C.h>
//I2C pins declaration
LiquidCrystal_I2C lcd(0x27, 2, 1, 0, 4, 5, 6, 7, 3, POSITIVE);
int Analog_Input = A0;
int lpg, co, smoke;

MQ2 mq2(Analog_Input);

void setup(){
  Serial.begin(9600);
  lcd.begin(16,2);//Defining 16 columns and 2 rows of lcd display
  lcd.backlight();
  mq2.begin();
}
void loop(){
  float* values= mq2.read(true); //set it false if you don't want to print the values in the Serial
  //lpg = values[0];
  lpg = mq2.readLPG();
  //co = values[1];
  co = mq2.readCO();
  //smoke = values[2];
  smoke = mq2.readSmoke();
  lcd.setCursor(0,0);
  lcd.print("LPG:");
  lcd.print(lpg);
  lcd.print(" CO:");
  lcd.print(co);
  lcd.setCursor(0,1);
  lcd.print("SMOKE:");
  lcd.print(smoke);
  lcd.print(" PPM");
  delay(1000);
}
After
uploading the code, you can start testing the sensor out using a small
lighter to see how it responds to the flame and gas. Start slowly and,
as always, be careful around flames.
4, Sound Detector.
| Hardware | |||
|---|---|---|---|
| 1. | Sound Detector | ||
| 2. | Particle Photon | ||
| 3. | Jumper wires | ||
| 4. | Breadboard | ||
This
project is for Lane of Things; a smaller version of Array of Things
which is described as, "an urban sensing project, a network of
interactive, modular sensor boxes that will be installed around Chicago
to collect real-time data on the city’s environment, infrastructure, and
activity for research and public use."
We
are studying the relationship between sound levels and time during the
day. Does sound increase as the time gets closer to the school day
ending? And if not what makes certain periods louder than others?
This
is interesting because the week that we collected data had a different
schedule everyday. The first day was shorter classes, the second skipped
periods 4, 5, and 6, then another day of shorter classes, and finally
the next day was all testing with no periods.
Prototyping the Project
First, we prototyped using cardboard and paper. Our prototype used hot glue and tape to secure the sides and the cone together.For the final product, we used a wood box as our enclosure. The box uses T-slots so that we can open and close the box when necessary. The box has 2 openings, one for the microphone of the sound sensor to stick out of, and the other for the power cord.
Attached on the box is a cone that we added to help direct the sound towards the microphone. We also engraved our contact information onto the box for anybody who had questions about what data we were collecting.
We had an issue with our breadboard fitting into the box because of a mistake with the size of the inside of the box compared to the size of the breadboard with the sensors attached. We fixed this problem by angling our breadboard inside of the box.

Laser cutting the sides of our box from Baltic Birch Plywood
We
went through several variations of code throughout this project. The
sound detector we used is relatively new and our main issue was that the
average values were not always logical, and the minimum value sometimes
surpassed the maximum. We also had to edit our Google Script Editor
code so that we could pull our values from the photon to our
spreadsheet. We did this by adding Particle variables that would be able
to be accessed by a unique URL by the Script Editor.
We
deployed our sensor in the front of a math class room. The classroom is
on the 3rd floor of Lane tech and is used for the majority of the day
including periods 1, 2, 3, 5, 7, and 8. The classroom is set up so that
all of the desks are facing towards our sensor with the teacher
lecturing at the front of the room adjacent to our sensor.

Our sensor under the whiteboard, attached by command strips and powered through an outlet.
We
had originally wanted to determine if our peers are more likely to talk
in the back of the room, or in the front of the room. We had to change
our idea because the week that we collecting data was also the week of
SAT testing which caused all the class schedules to be different. We
felt that the combination of scheduling and moving the sensor would
cause our data to be inaccurate.
We
learned a lot about coding and the difference between pulling and
pushing data. Each member of our group had coding experience but had not
used the Particle platform before.

The final product.
Data Collection Results
When we stopped collecting data we had over 150, 000 data points. We found that the average sound levels did increase throughout the day with spikes during the beginning and end of a class period. These same spikes are also seen in our minimum and maximum data, minimum barely changes while maximum has a spike for the start and end of each period.There are also low points in our "Avg Sound Levels" graph during the middle of the class periods, especially from 10:45-1:25 which we believe is because many students leave the school for lunch.
We
also noticed that each day had a higher average than the one before it.
This shows that not only does the sound increase as the school day
comes to an end, but also as the week comes to an end. When comparing
data collected before and after school, we noticed that the graphs
mirrored each other. The major spike in both graphs represents students
rushing to class, and rushing to leave school. We were surprised that
after school did not show a slower decline because we assumed that kids
would stay longer to go to clubs or sports.

5, build a bicycle horn with variable tone and volume.
The
LM555 generates an electronic horn signal which is amplified by an
LM386. The tone and gain of the horn can be easily varied. The horn can
be used in a car, scooter, cycle, and motorbike.
Step 1: Parts and Tools
Electronic Components
- 1x IC 555
- 1x IC LM386
- 2x IC Holder
- 1x 10Ω Resistor
- 1x 1KΩ Resistor
- 1x 2KΩ Resistor
- 3x 10KΩ Potentiometer
- 1x Tactile Momentary Push Buttons
- 1x 5mm LED
- 1x 0.1uF Capacitor
- 1x 10uF Capacitor
- 1x 100uF Capacitor
- 1x 220uF Capacitor
- 1x 10nF Capacitor
- 1x 47nF Capacitor
- 1x 100nF Capacitor
- 1x Speaker
- 1x 9V Battery Holder
- 1x 9V Battery
- 1x PCB
Tools
- Soldering Iron
- Soldering Wire
- Mini PCB Hand Drill + Bits
- You can also Buy the PCB
Step 2: LM555 Explained
The
555 is a highly stable device for generating accurate time delays or
oscillation. Additional terminals are provided for triggering or
resetting if desired. For stable operation as an oscillator, the free
running frequency and duty cycle are accurately controlled with two
external resistors and one capacitor. The circuit may be triggered and
reset on falling waveforms, and the output circuit can source or sink up
to 200mA or drive TTL circuits.
Step 3: LM386 Explained
The
LM386 is a power amplifier designed for use in low voltage consumer
applications. The gain is internally set to 20 to keep external part
count low, but the addition of an external resistor and capacitor
between pins 1 and 8 will increase the gain to any value from 20 to 200.
The inputs are ground referenced while the output automatically biases to one-half the supply voltage.
The inputs are ground referenced while the output automatically biases to one-half the supply voltage.
Step 4: Working & Calculations

An
LM555 is used to generate the horn signal. The LM555 is connected such
that it will trigger itself and free run as an astable multivibrator.
The external capacitor charges through Ra+Rb and discharges through Rb.
Thus the duty cycle may be precisely set by the ratio of these two
resistors.
In this mode of operation, the capacitor charges and discharges between 1/3 VCC and 2/3 VCC. Hence the charge and discharge times, and therefore the frequency is independent of the supply voltage.
A momentary switch acts as an input trigger that enables the astable multivibrator to generate a signal of variable frequency. This signal is then sent to an amplification unit before it is played through a speaker. The frequency and volume of the horn sound can be varied as shown.
Step 5: Circuit Schematic

A
potentiometer R3 (Rb) is varied in order to change the frequency of the
signal generated by the LM555. The signal is then passed to the LM386
for amplification.
The input signal is passed through another potentiometer R4 before it reaches the LM386. This pot is used to change the amplitude (volume) of the input signal before amplification.
The LM386 has a 10uF capacitor and 10K potentiometer R5 connected between pins 1 and 8. By varying this pot, we can change the gain of the amplifier and thus the volume of the amplified signal.
A push button/ momentary switch is used to turn on the circuit thereby producing a loud horn sound.
Capacitors connected across the supply terminals are used to minimize any noise signals.
Eagle Schematic: GitHub
Step 6: PCB Fabrication
Step 7: Circuit Assembly
Place
and solder all the components onto the PCB. Double check components
with polarities. Lastly, solder the Power adapter and speaker to the
PCB.
Step 8: Adjust the Tone and Volume
You can vary the tone and volume of the horn by changing the position of the potentiometers using a screwdriver.
Potentiometer R3 is varied to change the tone(frequency) of the horn. Potentiometer R4 is used to change the volume(amplifier gain) of the horn.
Potentiometer R3 is varied to change the tone(frequency) of the horn. Potentiometer R4 is used to change the volume(amplifier gain) of the horn.
Share Your Experience!
Are
you an engineer or hobbyist who has a great idea for a new feature in
this project? Maybe you have a good idea for a bug fix? Feel free to
grab the schematics from GitHub and tinker with it.
If you have any questions/doubts related to this project, leave them in the comments section and I will try my best to answer them.
No comments:
Post a Comment